
Signal and Filters Sample
This sample app contains live visualizations of some of the advanced signals, data and filters included in Tobii Ocumen.
Table of Contents
Download
Here, you can download the prebuilt sample for your device.
| Device | Download |
|---|---|
| Pico Neo 3 Pro Eye | |
| HP Reverb G2 Omnicept Edition |
Input
To pause the visualizations you can press the Configured Button.
The Configured Button is any of the following:
- Spacebar
- Pico headset button
- Controller trigger button
Scene Contents
General Info
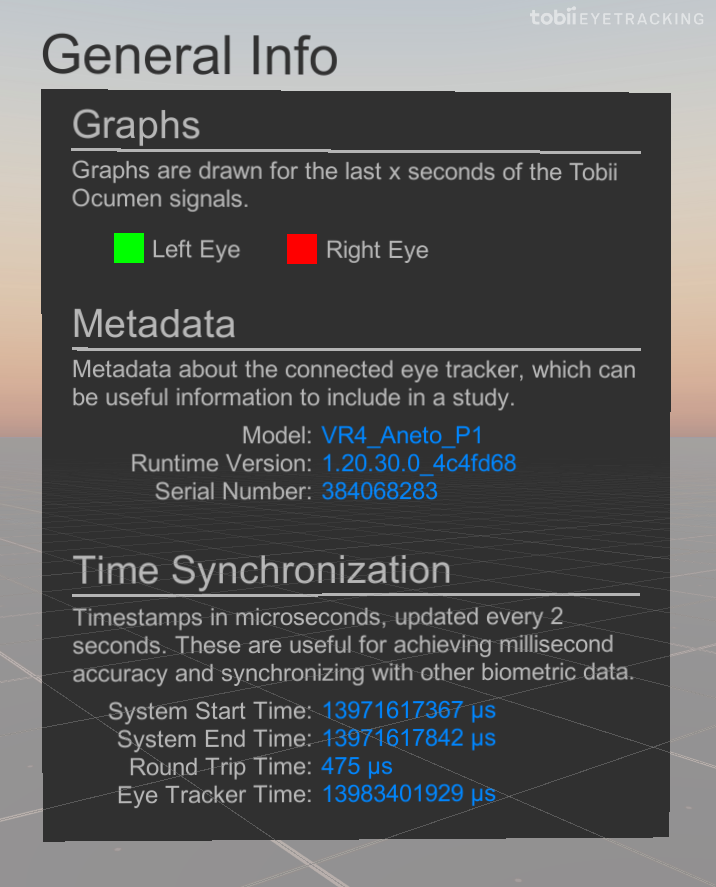
The General Info displayed on the left contains information about the scene as well as the eye tracker.
Metadata: Information about the eye tracker specifications, such as eye tracker model and serial number.
Time Synchronization: Data useful for millisecond accuracy and to synchronize the eye tracking data with other inputs and system. You can read more about time synchronization here. In this example, the information here is updated every 2 seconds.
Keep in mind that the eye tracker is already synced with the system clock on the Pico Neo 3 Eye.
Advanced Signals Graphs
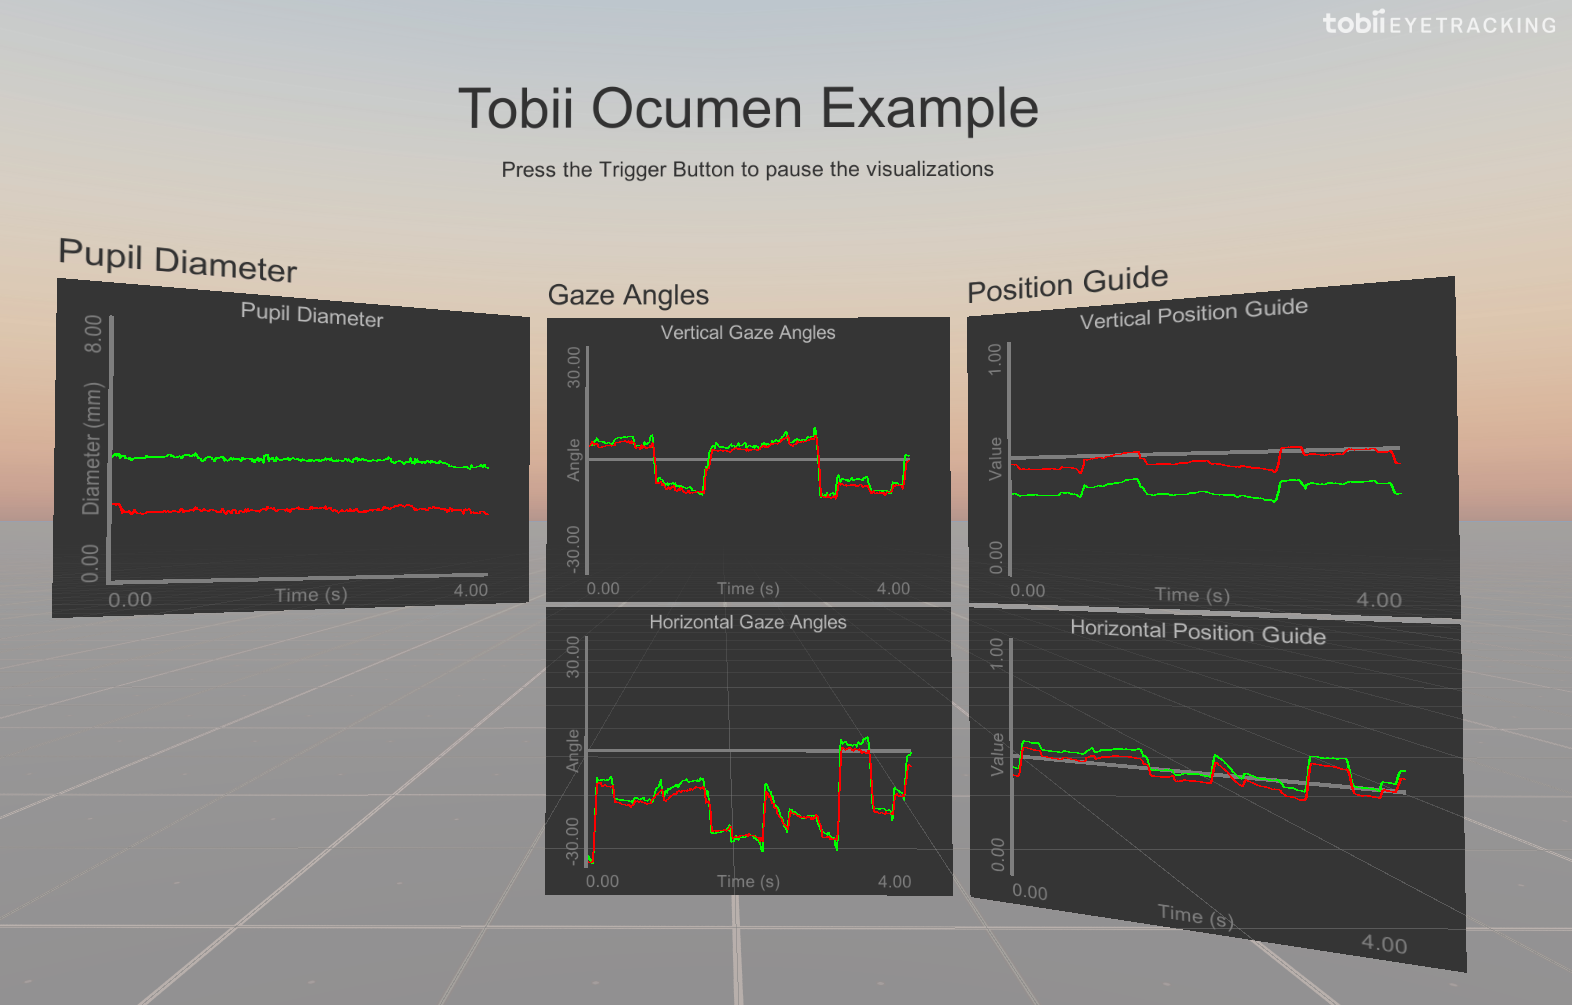
The first segment of graphs visualizes some of the signals from the Advanced API - currently the user’s pupil diameter, gaze angles and position guide signal for left and right eyes.
The current graph implementation will not render data that is flagged as invalid by the API.
Eye Visualizations
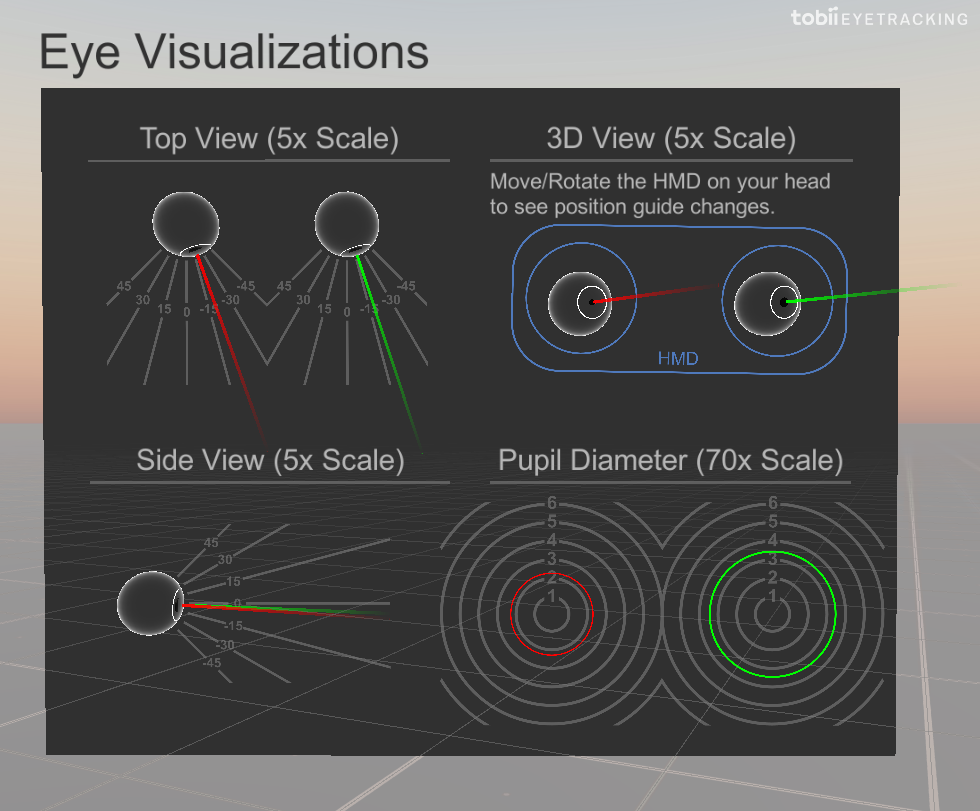
The eye visualizations panel (to the right of the signal graphs) displays a front, top and side view of your eyes. It also contains an HMD visualization based on the position guide signal as well as a visualization comparing relative pupil diameter changes.
In this visualization, the eyes will also be hidden whenever the user blinks with that eye.
The recorded participant has an eye condition making his left pupil react less to light which can be seen in the visualization here.
Filter Graphs
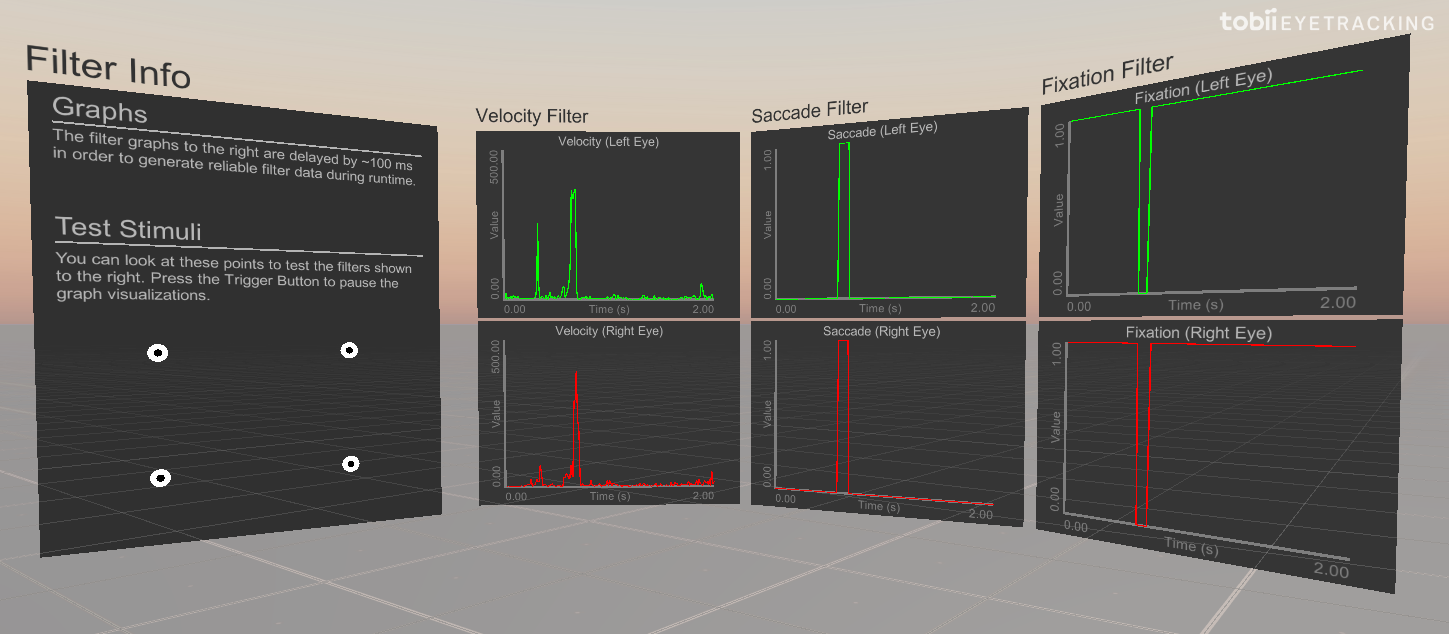
Further to the right, you can find graphs visualizing some of the eye movement classifiers from the filter pipeline. Currently, velocity, saccade and fixation data are displayed. There are also some stimulus points to test the filters.
By looking at the stimulus points and pressing the Configured Button to pause the graph visualizations, you can test out the filters.